Interactive Wildlife Observation Map of Jackson Hole, WY
Written by Emily Smith, TCD Technician
When you’re driving and spot a moose or a bear in a meadow, what’s your first instinct? For many, it’s to slow down and take a picture. It feels like a special moment worth saving for later. But that quick photo can become something more.
Programs like iNaturalist turn everyday wildlife sightings into data that scientists, land managers, and conservationists can use to understand the landscape better. In places where wildlife and people share space in increasingly complex ways, that information matters.
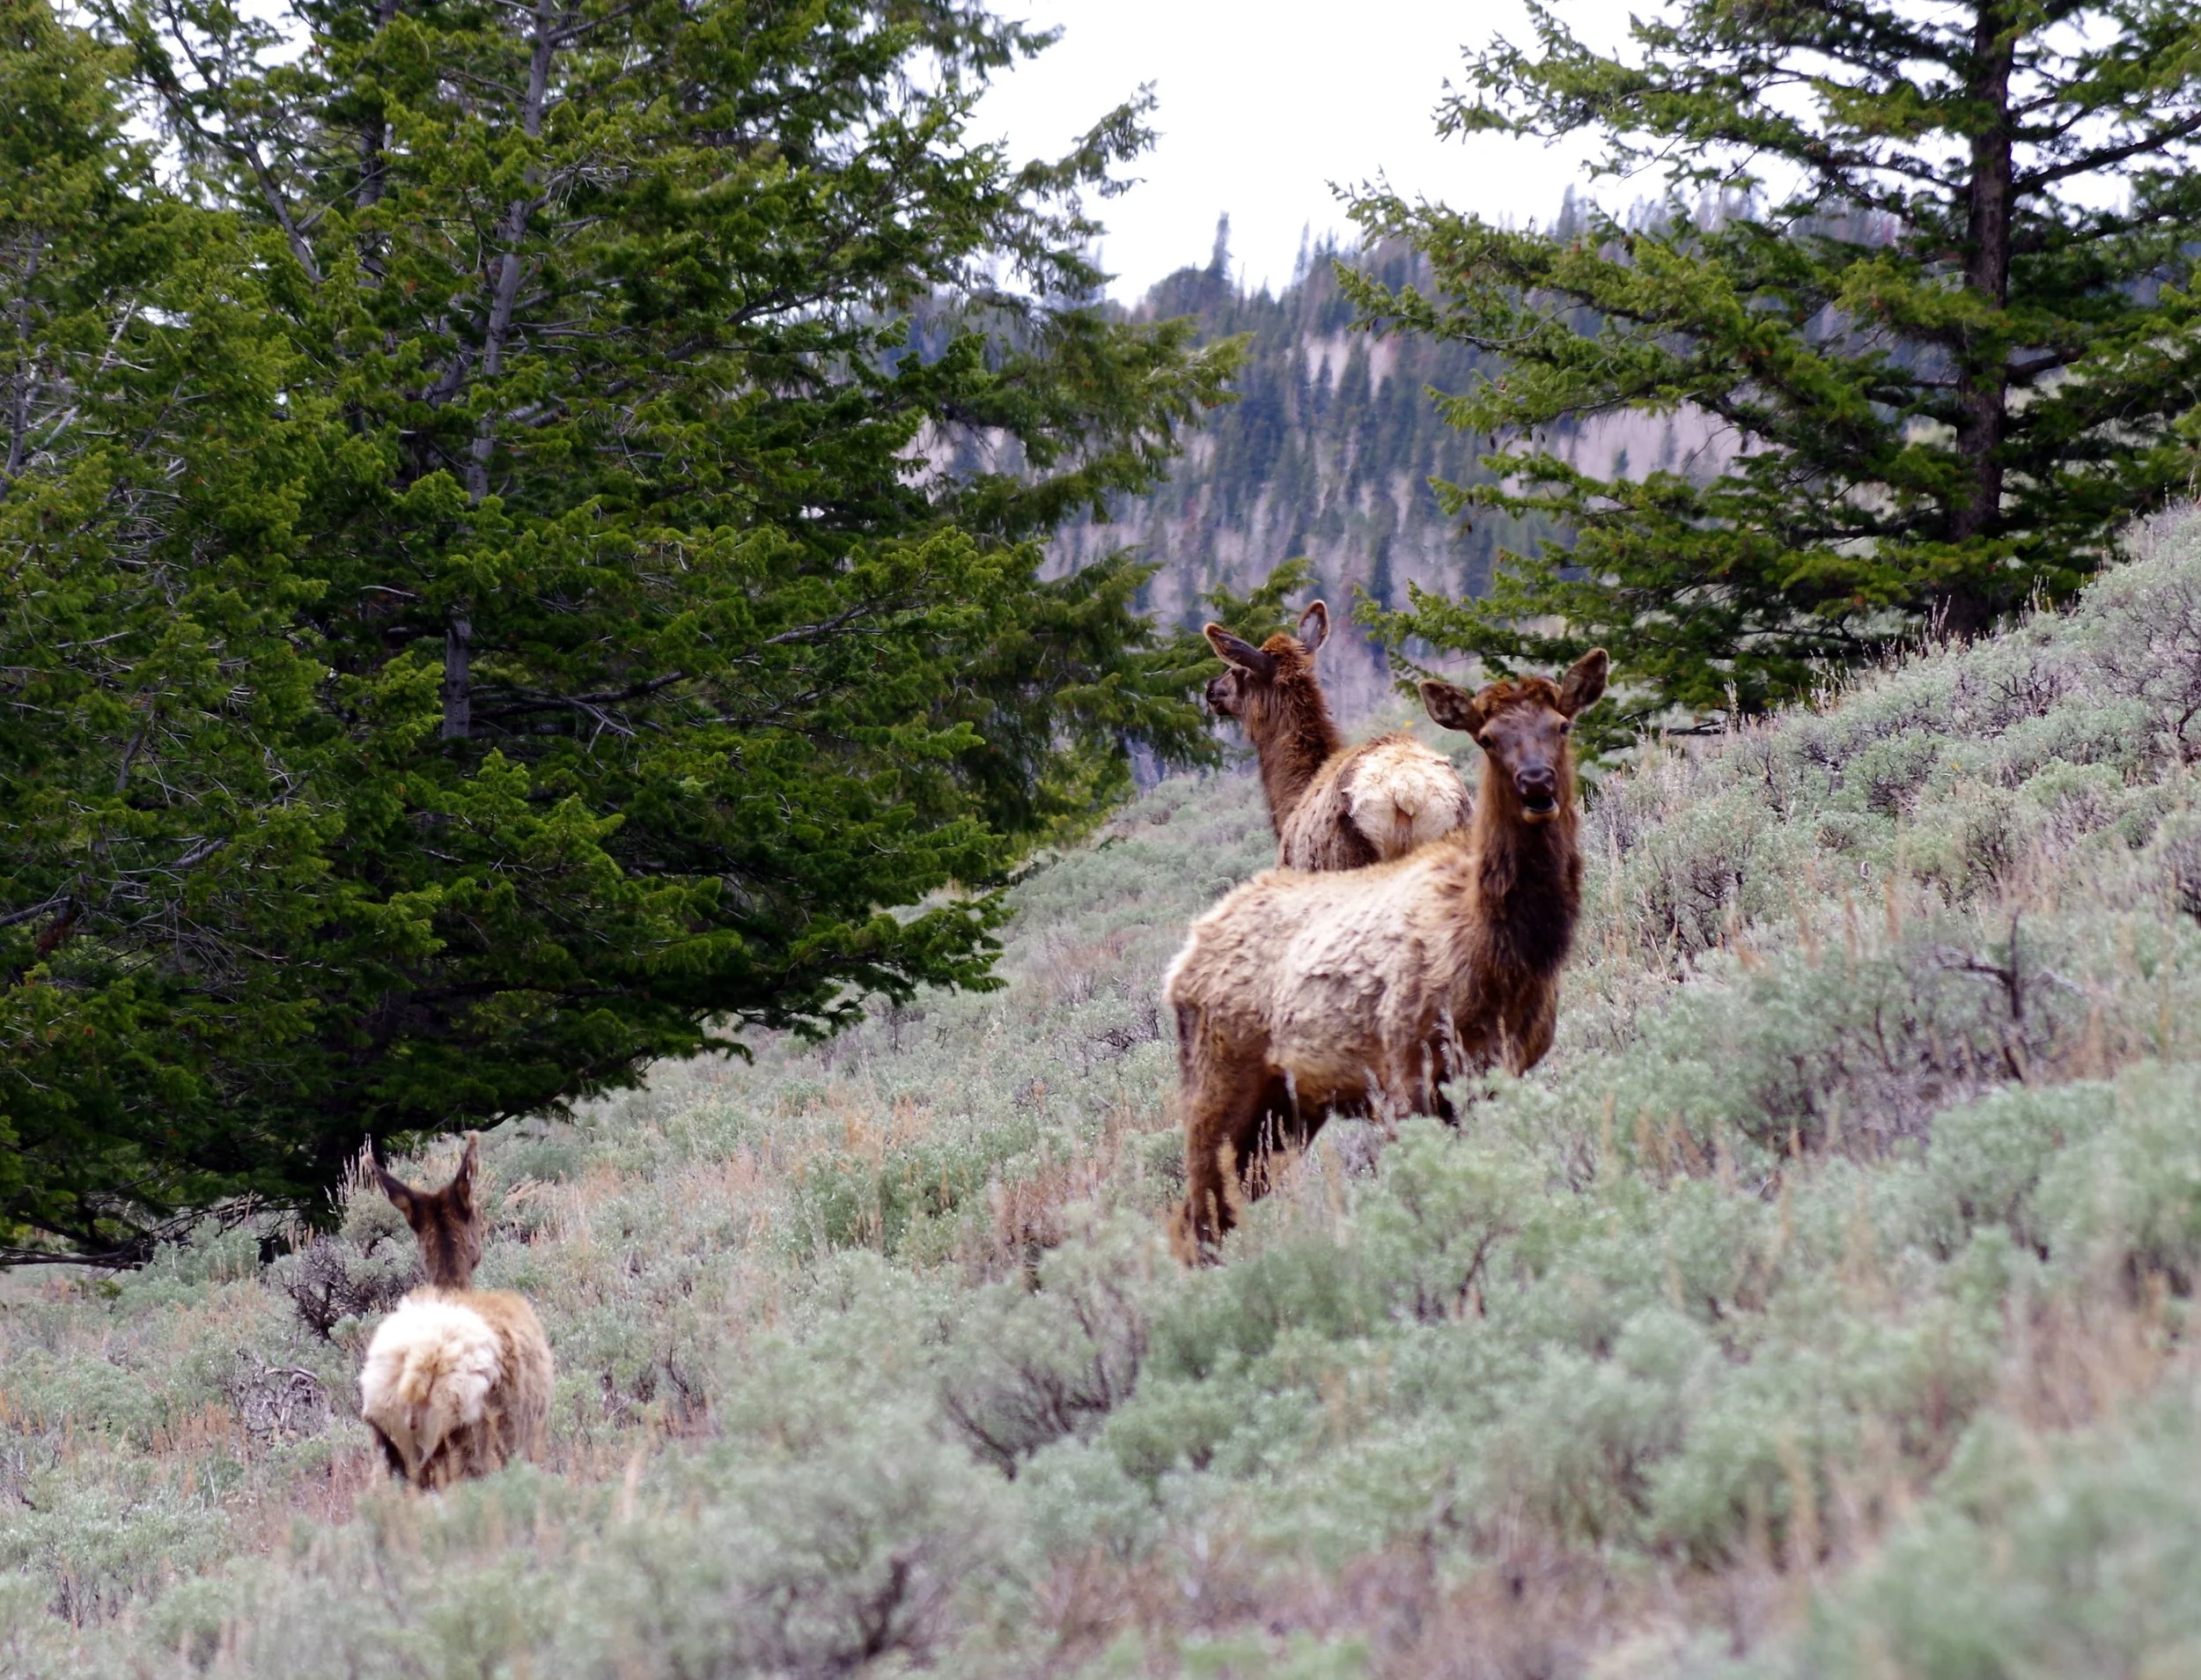
iNaturalist is a global citizen science platform where anyone can record what they see, including plants, animals, insects, and fungi. Established in 2008, iNaturalist has grown into one of the largest biodiversity databases worldwide. It currently contains over 300 million observations contributed by nearly 10 million users, covering more than 550,000 species. What makes it especially compelling is that it doesn’t require you to be an expert to contribute.
What makes iNaturalist unique is its blend of scale, accessibility, and community-driven data validation. Users upload observations and photos, and others in the community can suggest or verify species identifications. Say you record a golden eagle near the Snake River and upload a photo to iNaturalist. Someone might suggest it is actually a juvenile bald eagle, based on its appearance and location, since bald eagles do not develop their characteristic white head and tail until they are about 5 years old. Over time, as more people weigh in, the observation gains confidence. When enough users agree, and the observation includes solid evidence and a photo, it is classified as “research grade.” This ensures quality control, making it a valuable resource for both education and research.
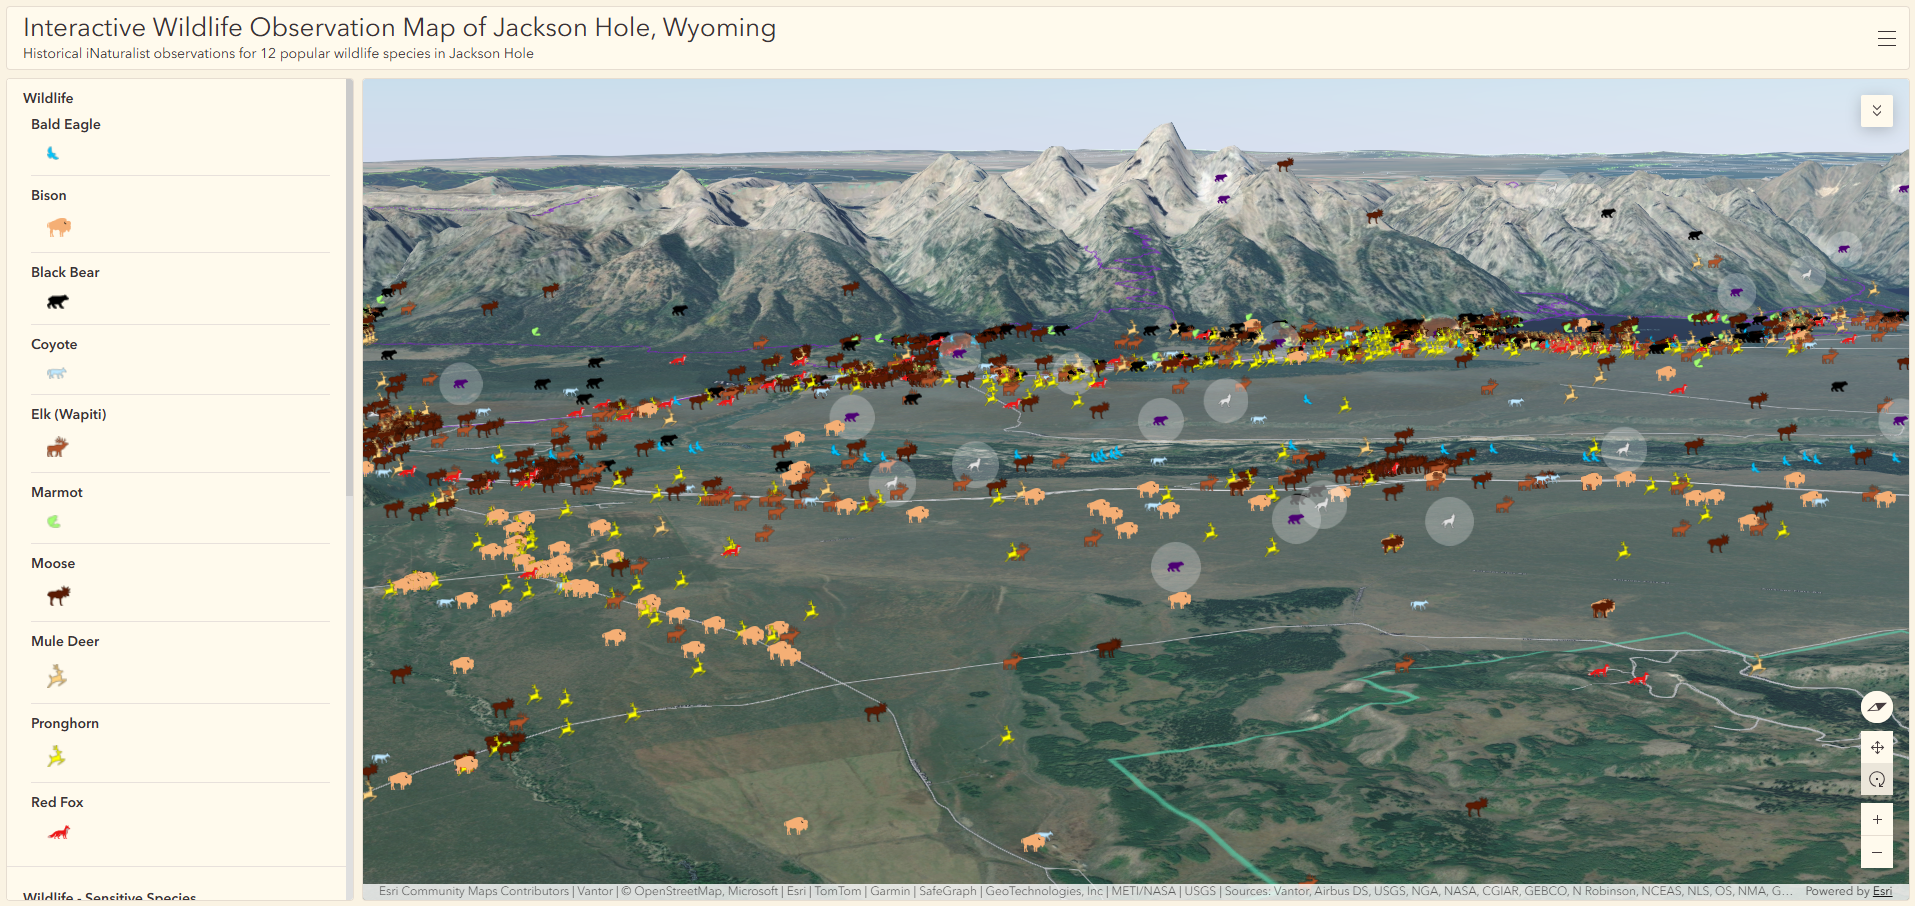
While pursuing a Master’s degree in Geographic Information Science and Technology at the University of Southern California, I used iNaturalist data to explore research-grade wildlife sightings in Jackson Hole. I built an interactive map based on more than 5,700 wildlife observations, focusing on 12 popular species, including moose, elk, bison, and wolves.
To access the full map online, click here.
The majority of observations occurred in recent years. Sightings were sparse before 2018. Since then, they have risen sharply, reaching 1,000 annually by 2024. That increase likely reflects both greater public interest and the growing ease of participation, driven by the increased prevalence of smartphones.
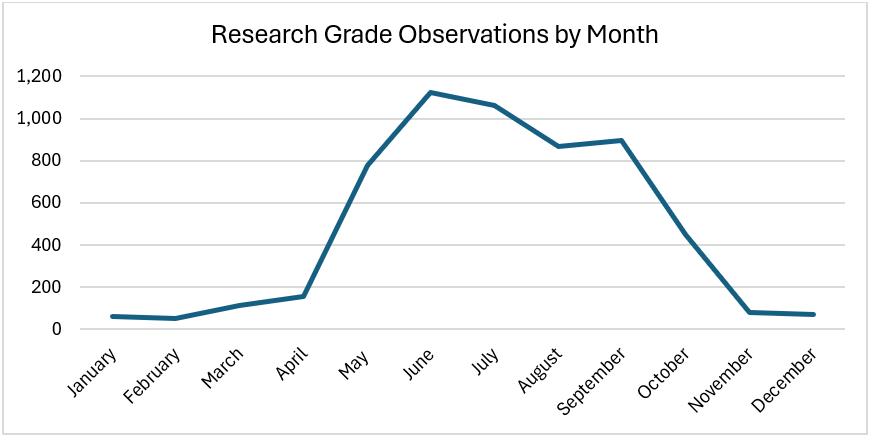
Not surprisingly, seasonal patterns in the observations show that summer is the peak. Trails are open, wildlife is active, and millions of visitors pass through the valley. In winter, the numbers drop off dramatically. This is due to wildlife being in less accessible areas, and simply fewer people are out looking for and recording the wildlife they see.
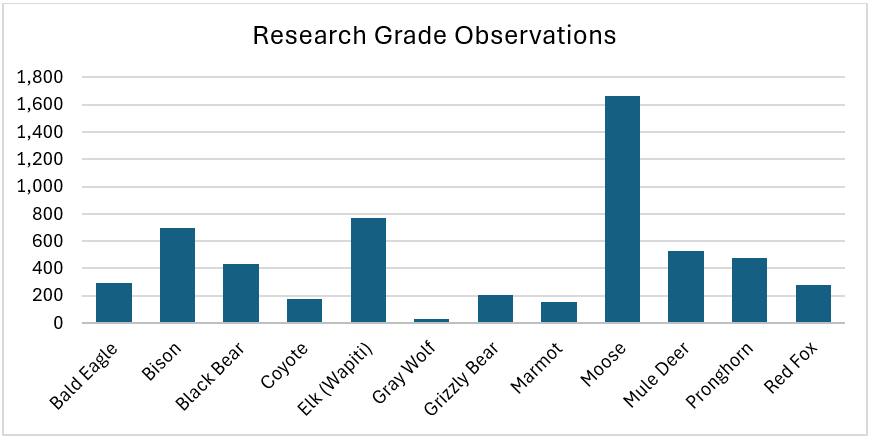
One surprising finding is the frequency of observations across species. At first glance, the record of observations seems to reveal which animals are most common. Moose, elk, and bison dominate the dataset. Wolves and marmots are the least recorded species. They aren’t necessarily scarce, though. Wolves are more difficult to observe and document. Marmots, on the other hand, are common sights on hiking trails and golf courses but may be considered less exciting and are not recorded as often as a result. These differences highlight an important concept in GIS and data science: the distinction between what is observed and what actually exists in the landscape.
This highlights strengths and limitations of using iNaturalist data. While it enables the collection of large amounts of data across extensive geographic areas that scientists could never collect on their own, the data coverage is uneven. Observations are concentrated in accessible areas due to human behavior, underrepresenting wildlife in remote regions. Additionally, charismatic or recognizable species are more frequently recorded. This pattern is clearly visible with bears, as recorded sightings often cluster where people are present, though GPS data shows they spend much of their time elsewhere. This pattern likely applies to many species; as a result, this data and map reflect our footprint as much as theirs.
Despite this shortcoming, citizen science platforms like iNaturalist and the local Nature Mapping Jackson Hole are incredibly powerful for revealing broad patterns. Nature Mapping Jackson Hole is a local wildlife data program that works with residents and visitors to record wildlife sightings and is managed by the Jackson Hole Wildlife Foundation. They can show how wildlife and plant observations change over time and even help detect shifts in species presence. For wildlife, they can also highlight areas where people frequently encounter animals. At the same time, they aren’t perfect. They can’t tell us exact population sizes, and they don’t capture everything happening in the backcountry.
For me, this project has changed how I think about both data and the landscape. It’s easy to see a map as an objective, clear picture of where wildlife is and what is out there. But in many ways, it’s also a reflection of human participation, for example, in where we travel, what we notice, and what we choose to record.
With support from the Teton Conservation District, I’ve been able to explore these ideas through my graduate studies and apply them to local conservation work. Looking ahead, I’m interested in how citizen science data may complement traditional methods, helping identify gaps in monitoring, better understand wildlife movement, and inform decisions about how we manage and protect this region.
So the next time you pull over to watch a herd of elk or catch a glimpse of a fox crossing the road, consider taking a photo and sharing it. That small moment might not just be a memory; it might be a data point that helps us better understand the wild landscape we all care about.